
Published on: December 16, 2025
The crypto market is once again under pressure as risk sentiment weakens globally, and newly launched tokens are facing extreme volatility. One of the most discussed names today is Monad (MON), which has fallen nearly 60% from its post-launch highs, triggering intense debate across social media and trading desks. The current monad price reflects this downturn.
While retail traders are questioning whether this dip presents a buying opportunity, whale positioning and technical indicators paint a far more cautious picture. By analyzing whale flow data, momentum indicators, and price structure, we can better understand what the Monad crash really means — and what may come next.
This analysis is based on real-time whale positioning data and multi-indicator technical signals, and is intended to provide market insight rather than financial advice.
As we analyze these trends, it’s crucial to observe the changing monad price and its implications for future investments.
Crypto Market Context: Why New Tokens Are Under Pressure
The current selloff in Monad is not happening in isolation. Over the past several days:
- Bitcoin has shown elevated volatility
- Altcoins have faced aggressive short positioning
- Liquidity conditions have tightened across derivatives markets
In such environments, newly launched tokens are often the first to see sharp corrections. Early investors take profits, liquidity thins out, and whales aggressively test downside levels to flush weak hands.
Monad’s price action fits squarely into this broader risk-off backdrop.
Monad Price Action: What the Chart Is Showing
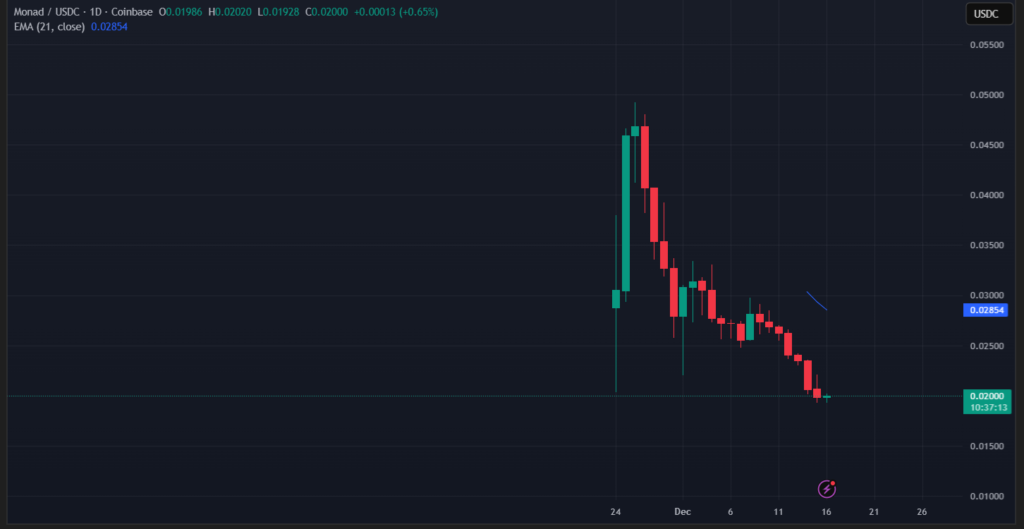
At the time of analysis, MONUSDT is trading near $0.0198, down more than 6% intraday and approximately 60% from its post-launch peak.
Key price observations:
- Price remains below the 21-period EMA, indicating a sustained bearish trend
- Lower highs and lower lows continue to form
- No confirmed trend reversal structure is visible yet
From a pure price-structure perspective, Monad is still in a downtrend, not a consolidation.
Technical Indicator Breakdown (4H Timeframe)
EMA (Exponential Moving Average)
- EMA(21) is sloping downward
- Price is consistently trading below EMA resistance
➡️ This confirms that sellers remain in control and rallies are being sold.
RSI (Relative Strength Index)
- RSI is hovering around 30–32
- This places Monad in oversold territory
➡️ Oversold does not automatically mean bullish. In strong downtrends, RSI can remain oversold for extended periods.
MACD
- MACD remains bearish
- Histogram is compressed near zero, showing weak momentum
➡️ This suggests selling pressure is slowing slightly, but no bullish crossover has occurred yet.
Volume Analysis
- Declining volume compared to the initial launch phase
- No strong volume spike signaling aggressive accumulation
➡️ Lack of volume confirms absence of strong dip-buying conviction so far.
Whale Positioning: The Most Important Signal Right Now
While indicators show oversold conditions, whale data reveals why price is still struggling.
Whale Overview (24H)
- Bias: Bearish
- Long Positions: 42.9%
- Short Positions: 57.1%
- Total Volume: $13.9M
Net Whale Pressure
- Whale Long Volume: ~$419K
- Whale Short Volume: ~$13.52M
- Net Whale Position: Short Heavy
➡️ Despite oversold indicators, whales are still net short, which is a strong signal that downside risk has not fully resolved.
Why Whales Are Still Shorting Monad
There are several strategic reasons why large players may continue to apply short pressure:
- Post-Launch Price Discovery
Early launches often experience exaggerated moves as fair value is established. - Liquidity Hunting
Whales often push price lower to force capitulation before accumulating. - Retail Psychology
Oversold indicators attract premature long entries — which whales fade. - No Structural Reversal Yet
Until price reclaims key moving averages, shorts remain statistically favored.
This behavior suggests that whales are positioning for volatility, not immediate recovery.
What Oversold Conditions Really Mean Here
Oversold readings often create confusion. It is important to understand:
- Oversold ≠ automatic bounce
- Oversold + whale shorts = high volatility zone
In many cases, markets will:
- Chop sideways
- Fake a relief bounce
- Resume trend if structure remains bearish
Without confirmed whale accumulation, oversold conditions alone are not enough to justify strong bullish bias.
Key Scenarios to Watch Next
Scenario 1: Dead-Cat Bounce (Short-Term Relief)
- RSI recovers slightly
- Price retests EMA resistance
- Whales use bounce to add shorts
➡️ This is the most common outcome in early downtrends.
Scenario 2: Prolonged Consolidation
- Price moves sideways
- Volume dries up
- Whale short pressure slowly reduces
➡️ This often precedes a more meaningful trend shift.
Scenario 3: Deeper Capitulation
- Market-wide risk-off intensifies
- Whales push price below recent lows
- Final liquidation flush occurs
➡️ Painful, but often where long-term accumulation begins.
Retail vs Whale Psychology
This is a textbook Retail vs Whale setup:
- Retail sees: “60% crash = cheap”
- Whales see: “Liquidity opportunity + weak structure”
Until whale positioning shifts decisively toward net long accumulation, rallies should be treated with caution.
External Reference (DoFollow)
For live Monad price, market cap, and broader metrics, you can track:
👉 Monad on CoinMarketCap
https://coinmarketcap.com/
Final Thoughts
The Monad price crash highlights how technical indicators and whale behavior must be analyzed together, not in isolation. While momentum indicators signal oversold conditions, whale positioning remains decisively bearish, suggesting that volatility is far from over.
Patience, risk management, and confirmation from both price structure and whale flows are critical before assuming any trend reversal.
Disclaimer
This content is for informational purposes only and does not constitute financial or investment advice. Cryptocurrency markets are highly volatile, and readers should conduct their own research before making any trading decisions.
For More Whale-Driven Crypto Analysis
Explore more in-depth market breakdowns and real-time insights here: