
Bitcoin price today is showing a complex tug-of-war between whale positioning and technical indicators, creating one of the most critical short-term setups traders have seen in recent sessions. While short-term indicators are flashing bullish momentum, whale data from leveraged markets paints a sharply bearish picture.
This divergence is exactly where high-probability moves are born.
In this analysis, we break down real whale positioning, multi-timeframe indicators, and what this conflict suggests next for BTC price today, using data derived from our internal whale and indicator monitoring systems.
This analysis is based on internal whale flow and technical indicator data and is not financial advice. today 15/12/2025
Bitcoin Price Today: Market Snapshot
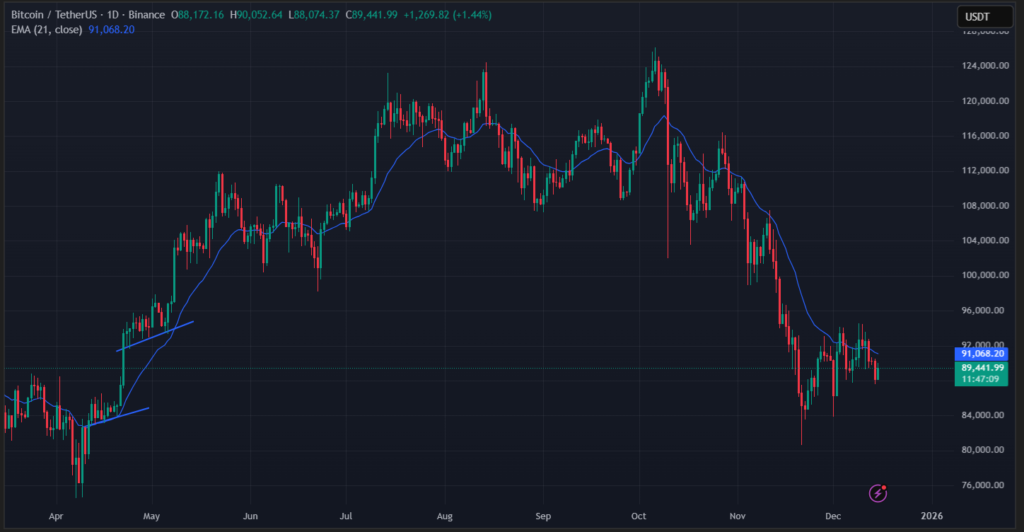
At the time of analysis, BTCUSDT is trading near $89,680, up roughly 0.5% on the day. On the surface, price action appears stable, but under the hood, positioning data reveals a very different story.
Key observations:
- Volatility is compressing
- Directional conviction is split across timeframes
- Whale leverage is heavily skewed to one side
This combination often precedes sharp directional moves.
Whale Positioning Overview: Strong Bearish Bias
The most important data point today comes from whale positioning, particularly in leveraged derivatives markets.
Current Whale Metrics
- Whale Bias: Bearish
- Short Positions: ~84.6%
- Long Positions: ~15.4%
- Total Whale Volume: ~$444M
- Net Whale Position: Short Heavy (~$433M net short)
This tells us one clear thing:
Large players are aggressively positioned for downside, despite Bitcoin holding near local highs.
Historically, such extreme imbalances tend to lead to one of two outcomes:
- Continuation moves (price moves in whale direction)
- Violent squeezes (price moves against whale positioning)
Which scenario plays out depends heavily on indicator confirmation.
Short-Term Indicators (1H): Bullish Momentum Emerging
On the 1-hour timeframe, technical indicators are flashing bullish continuation signals.
1H Indicator Breakdown
- EMA: Bullish (price above EMA)
- MACD: Bullish crossover
- RSI: 55 (healthy momentum, not overbought)
- Bollinger Bands: Mid-range
- Volume: Normal
Combined Signal (1H)
- BUY Setup
- Medium Confidence
- Top Confluence: EMA Bull + MACD Bull
This suggests short-term momentum traders are stepping in, possibly attempting to force a move higher against heavy short positioning.
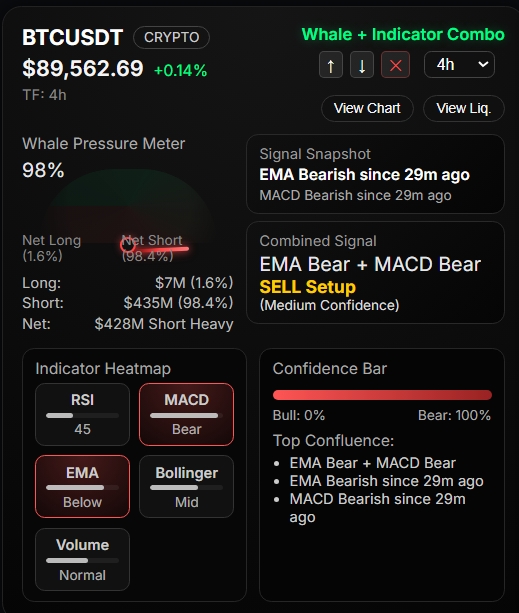
Higher Timeframe Indicators (4H): Bearish Structure Remains
Zooming out to the 4-hour timeframe, the picture changes completely.
4H Indicator Breakdown
- EMA: Bearish (price below EMA)
- MACD: Bearish crossover
- RSI: 46 (weak momentum)
- Bollinger Bands: Mid-range
- Volume: Normal
Combined Signal (4H)
- SELL Setup
- Medium Confidence
- Top Confluence: EMA Bear + MACD Bear
This confirms that larger trend participants are still leaning bearish, aligning closely with whale positioning.
Why This Conflict Matters for BTC Price Today
This is the critical insight traders must understand:
- Whales are short
- 4H trend is bearish
- 1H momentum is bullish
This creates a compression zone, where price is being pulled in opposite directions.
Two High-Probability Scenarios
Scenario 1: Whale Bias Wins (Continuation Down)
If short-term bullish momentum fails:
- BTC loses intraday support
- Price aligns with whale positioning
- Downside acceleration becomes likely
This scenario typically plays out when:
- 1H indicators roll over
- Volume spikes on red candles
- RSI fails to reclaim higher levels
Scenario 2: Short Squeeze (Counter-Move Up)
If 1H bullish momentum holds:
- Over-leveraged shorts get trapped
- Price spikes rapidly
- Move is sharp but often short-lived
This usually happens when:
- EMA support holds
- MACD expansion continues
- Liquidation clusters get triggered
What Bitcoin Whale Data Suggests Next
Based on current data, whales appear confident but crowded.
Extreme short dominance (>80%) increases:
- Short-term volatility
- Risk of forced liquidations
- Probability of fake breakdowns or fake breakouts
However, because higher timeframe indicators remain bearish, any upside move is more likely to be:
- A squeeze, not a trend reversal
- A distribution opportunity, not accumulation
Key Levels Traders Should Watch
While exact levels depend on execution strategy, structurally traders should monitor:
- Intraday EMA support (1H)
- Recent range highs near resistance
- Volume expansion on breakdown or breakout
A failure to hold short-term EMA support would strongly favor whale continuation to the downside.
What This Means for Traders Today
For traders and analysts, today’s setup suggests patience over prediction.
Key takeaways:
- Do not blindly follow short-term bullish signals
- Respect whale positioning and higher timeframe structure
- Expect volatility expansion after compression
This is a reaction-based environment, not a prediction-based one.
Live Bitcoin Whale Analysis Going Forward
This analysis is part of our ongoing effort to track real-time whale positioning and indicator confluence, helping traders understand where smart money is leaning, not just where price has been.
As market conditions evolve:
- Whale exposure shifts
- Indicators realign
- Confidence levels change
Staying updated with live whale activity and multi-timeframe analysis is critical in markets like this.
Final Verdict: BTC Price Today
Bitcoin price today is sitting at a decision point.
- Short-term momentum: Bullish
- Higher timeframe trend: Bearish
- Whale positioning: Aggressively short
Until these align, traders should expect sharp moves, false signals, and rapid sentiment shifts.
The next major move will not come from indicators alone —
it will come from how price reacts to whale pressure.
🔗 Internal Reference
- Live Bitcoin Whale Activity Dashboard (coming soon)
- Daily BTC Whale & Indicator Analysis
Recommended External References
- CoinMarketCap (Price Data)
https://coinmarketcap.com
BTC currently trades near $89,000, confirming high intraday volatility. - TradingView (Trend Analysis)
https://tradingview.com