
Updated: {2025/1712}
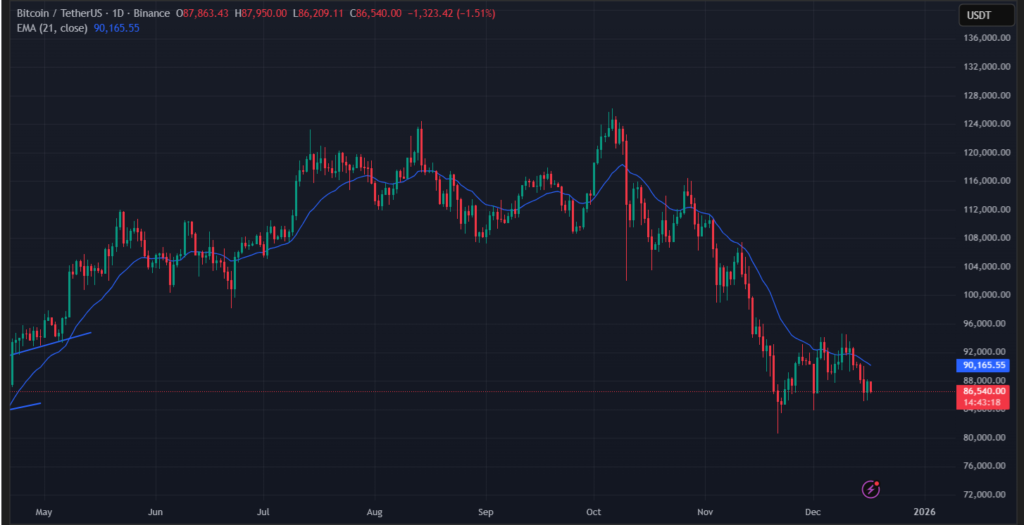
Bitcoin price is trading near $86,404, showing limited movement over the recent session despite noticeable activity beneath the surface. While price action remains relatively stable, positioning data highlights a clear contrast between short-term bearish whale pressure and higher-timeframe uncertainty, suggesting the market is approaching a sensitive phase.
On lower timeframes, whale positioning has turned decisively short-heavy, while broader indicators on higher timeframes fail to confirm a strong directional trend. This imbalance indicates that Bitcoin price is not being driven by momentum alone, but by positioning shifts and risk management behavior among large participants. Such conditions often reflect a market that is stable on the surface, yet increasingly reactive to liquidity and indicator changes.
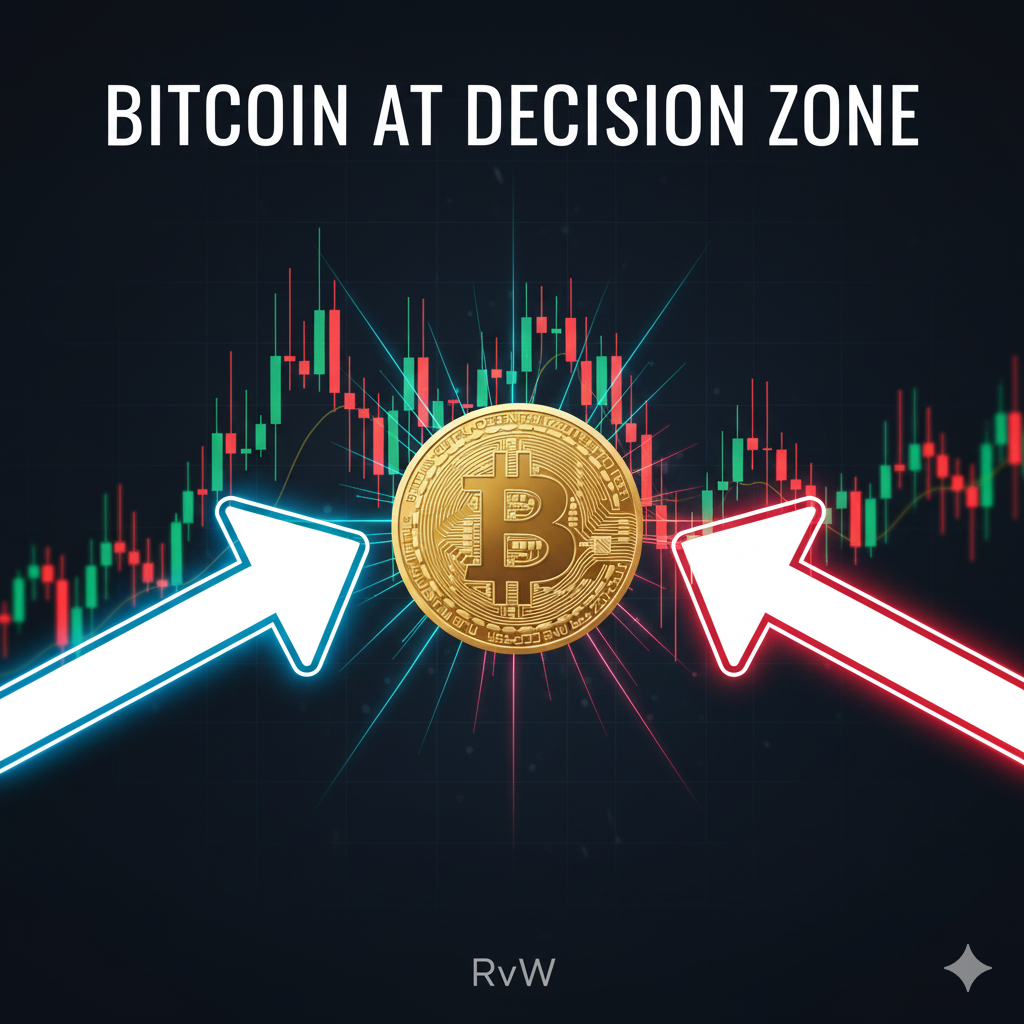
Bitcoin Price: Low Volatility, High Tension
Bitcoin is currently experiencing:
- Compressed volatility
- Neutral higher-timeframe signals
- Aggressive short-term whale positioning
Such conditions typically emerge when markets pause after a strong move, waiting for confirmation from liquidity, momentum, or macro catalysts.
Global Day 10 reflects exactly this state: decision without resolution.
Whale Positioning Breakdown: Heavy Short Bias Emerges
Overall Whale Overview
- Whale Bias: Bearish
- Long Positions: 32.1%
- Short Positions: 67.9%
- Total Whale Volume: $339.3M
- Net Whale Position: Short Heavy
Net Whale Pressure
- Whale Long Volume: $21.3M
- Whale Short Volume: $317.9M
- Net Short Exposure: ~$297M
This data clearly shows that whales are defensively positioned, favoring downside protection rather than aggressive long exposure. Importantly, this does not guarantee price continuation — it highlights risk awareness and positioning imbalance.
Timeframe Analysis: Conflicting Signals Across Frames
🔹 4H Timeframe — Neutral but Fragile
- MACD: Bullish (very recent)
- EMA: Below price (bearish structure)
- RSI: 37 (weak momentum)
- Bollinger Bands: Mid-range
- Whale Pressure: Neutral (0%)
Interpretation:
The 4H timeframe reflects stalling momentum, not strength. Indicators are mixed, showing that Bitcoin is holding ground — but without confirmation of trend reversal.
🔹 1H Timeframe — Strong Bearish Pressure
- Whale Pressure Meter: 94%
- Net Whale Position: Short Heavy
- EMA: Bearish
- MACD: Bearish
- RSI: 40
- Combined Signal: EMA Bear + MACD Bear
- Confidence: Medium (Bearish)
Interpretation:
Short-term traders and whales are actively positioning for downside risk. This suggests short-term pressure, even as higher timeframes remain unresolved.
Indicator Heatmap Summary
| Indicator | Status |
|---|---|
| RSI | Weak (Below 40) |
| MACD | Bearish on 1H |
| EMA | Below price |
| Bollinger | Neutral |
| Volume | Normal |
The indicator setup reinforces the idea of compression rather than continuation.
Retail vs Whale Psychology
- Retail Behavior: Waiting for confirmation, reacting to price stability
- Whale Behavior: Actively hedging with short exposure
This divergence often appears near decision zones, where price remains stable but positioning becomes increasingly one-sided.
Such imbalances typically precede either short-covering volatility or continuation after liquidity resolution — but at this stage, the outcome remains open.
Scenarios Ahead (No Prediction)
Scenario 1: Short-Term Volatility Expansion
If short-term pressure intensifies, Bitcoin may experience temporary downside probes as liquidity is tested.
Scenario 2: Stabilization and Rebalancing
If price holds while whale shorts remain crowded, position adjustments could reduce pressure and restore balance.
Both scenarios fit the Global Day 10 framework — decision pending, direction unconfirmed.
Bitcoin Market Data Reference
For broader market statistics and circulating supply data, readers can cross-check public metrics on CoinMarketCap
What This Means for Bitcoin Right Now
Bitcoin is not signaling a clear trend. Instead, data suggests:
- Short-term stress
- Higher-timeframe hesitation
- Whale-driven risk management
- A market waiting for confirmation
This is the definition of a critical decision zone.
🔗 Internal Reference:
Related Bitcoin analysis and updates can be found here:
👉 https://crypto-news.page/bitcoin/