
Bitcoin price analysis today shows a heavy imbalance between long and short positions as whales load up $362 million in net shorts, pushing BTC into a deeper consolidation below the $90,000 handle. While MACD has flashed a fresh bullish signal on both the 1-hour and 4-hour timeframes, the EMA trend remains firmly bearish — creating a rare, conflicting setup that often precedes a sudden volatility expansion.

At the time of writing, BTC trades near $90,376, down 1.57% on the day, with sentiment split cleanly in half:
50% bullish vs 50% bearish according to the RvW Confidence Bar.
Let’s break down today’s market dynamics using whale positioning, technical indicators, and the latest trend signals from the RvW Dashboard.
📊 Bitcoin Price Analysis Today — Market Overview
Bitcoin continues to hover below the critical $90K psychological barrier, struggling to reclaim bullish momentum after a week of declining open interest and fading leveraged long participation. Funding rates across major exchanges have also cooled — a trend previously reported by crypto.news — suggesting lower conviction among bullish traders.
However, the RvW engine reveals something more important:
Whale behavior is aggressively shifting bearish.
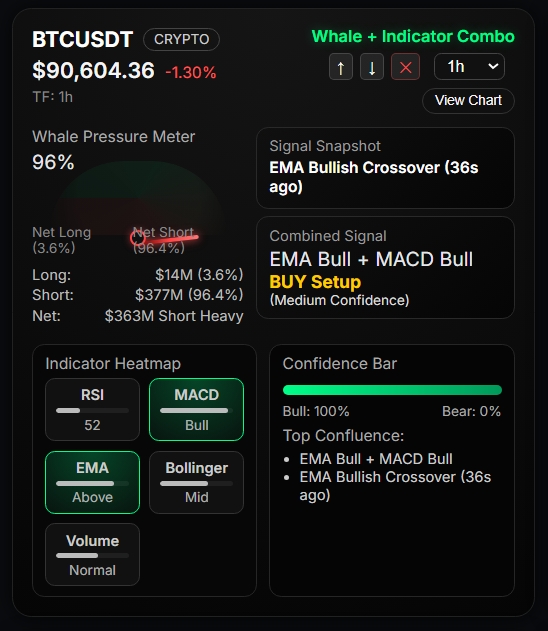
- 96% net bearish pressure
- $379M in short positions vs just $16M in longs
- Avg whale entry: $96,661
- Avg whale PnL: +66.97% → they are still far in profit
- Bias: Bearish
This imbalance tells us whales are positioning ahead of a potential volatility move — and they’re heavily leaning toward downside.
🐋 Whale Activity: $362M Shorts Signal a Bearish Pressure Wave
Whale metrics are the strongest leading indicator in today’s Bitcoin price analysis.
✔ Whale Pressure Meter (1H & 4H)
- Net Long: 4.1%
- Net Short: 95.9%
- Total Shorts: ~$379M
- Total Longs: ~$16M
- Net Short Volume: $362M Short Heavy
The concentration of short positions at these levels implies:
- Whales expect a rejection near $90K
- They anticipate a liquidity sweep of lower levels
- Any bounce is being shorted into
Moreover, the RvW “Volume Down” metric shows $394.7M of downward pressure — another strong bearish confirmation.
📈 Bitcoin Technical Indicators Today (1H & 4H)
Even though whales are overwhelmingly short, the indicators tell a more nuanced story.
Let’s break it down.
🔷 MACD: Bullish on 1H and 4H
- 1H MACD: Bullish (triggered seconds ago)
- 4H MACD: Bullish (triggered 15 minutes ago)
MACD flips often mark the beginning of micro-trend reversals.
But when MACD goes bullish while EMA is bearish, historically this leads to:
- A fakeout bounce, OR
- A compression phase before a bigger directional move.
🔶 EMA Trend: Bearish Across Timeframes
- 1H EMA → Bearish
- 4H EMA → Bearish
This is important.
Whenever Bitcoin trades below EMA on higher timeframes, bullish MACD signals tend to fail unless validated by whale buying — which is NOT happening.
This adds weight to the bearish scenario.
🔸 RSI (1H): 49 — Neutral Zone
RSI at 49 indicates:
- No overbought pressure
- No oversold bounce setup
- Market is waiting for a catalyst
This is typical during whale accumulation or distribution phases.
🔹 Bollinger Bands: Midline Compression
BTC is sitting at the middle band, implying:
- Low volatility
- Squeeze conditions forming
- Price preparing for an expansion move
Given whales are short-heavy, volatility expansion risk is currently downward.
🔎 Bitcoin Support and Resistance Levels Today
🟥 Immediate Resistance:
- $90,800 – $91,200
Whales aggressively short this zone.
🟦 Local Support:
- $88,500 – $89,000
Break below this support could open downside toward:
🟦 High-Timeframe Support:
- $86,200
- $84,900
If BTC loses $87K with volume → expect acceleration.
🟩 Bullish Trigger (Invalidates Downtrend):
- 4H close above $92,000
- Whale shorts unwind
- EMA reclaim on both 1H + 4H
⚔️ Conflicting Signals: What Does This Mean for BTC?
Today’s Bitcoin price analysis reveals a rare setup:
🟢 MACD → Bullish
🔴 EMA → Bearish
🔴 Whales → Heavily Short
⚪ RSI → Neutral
This combination often precedes:
📌 A liquidity hunt
OR
📌 A slow grind lower before a larger move
Given $362M whale shorts, the bias leans toward:
👉 Downside continuation unless BTC reclaims $92K.
🧠 Is a Deeper Correction Coming? (Expert Outlook)
Based on whale flows + indicator confluence:
✔ Probability of downside (next 24 hours): 60–65%
✔ Probability of upside squeeze: 35–40%
(small chance due to bullish MACD)
If BTC breaks below $89K, expect:
- Increase in volatility
- Flush of late longs
- Potential wick to $87K–$86K
- Whales taking profit on shorts
On the other hand, a strong hourly candle above $91K would invalidate immediate downside.
But until whales flip, macro bias remains bearish.
🧩 Final Verdict — Bitcoin Trend for the Next 24 Hours
Based on Bitcoin price analysis today, the market is in a fragile, whale-dominated zone.
🔻 Bearish Case (Primary Scenario):
- BTC fails to reclaim $90.8K
- Price breaks $89K
- Downtrend accelerates
- Target: $87K – $86K
🔺 Bullish Case (Secondary Scenario):
- MACD continues upward strength
- BTC breaks above $92K
- Short squeeze triggers
- Target: $94K – $96K
Whales are in control.
Retail is neutral.
Indicators are mixed.
Net outcome: Bitcoin leans bearish today unless bulls reclaim key levels.