
Updated: December 17, 2025
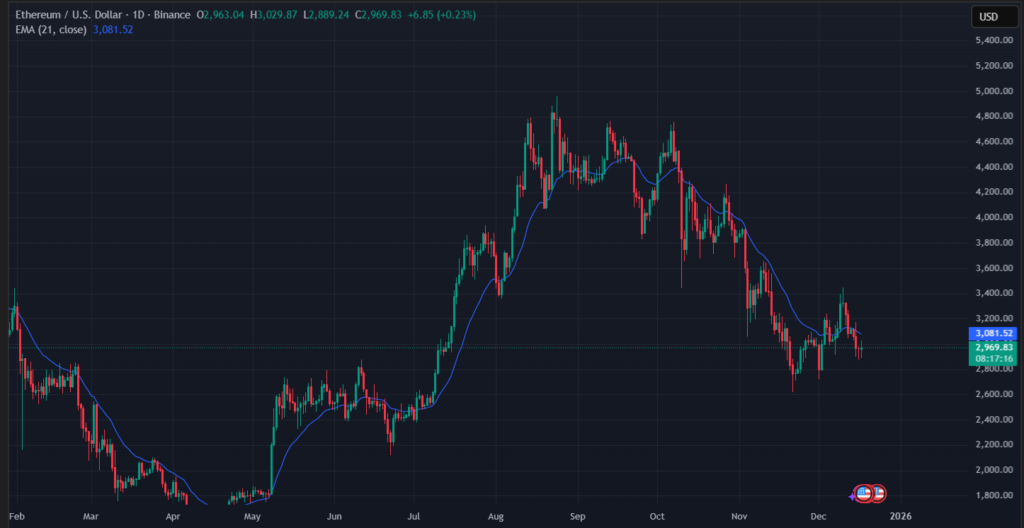
Ethereum price is trading near $3,009, gaining over 3% in the latest session as short-term momentum strengthens across multiple timeframes. The move is supported by bullish indicator alignment and a fresh volume spike, signaling renewed activity. However, beneath the surface, ETF flows and whale positioning continue to reflect caution, creating a clear divergence between price momentum and institutional behavior.
This contrast places Ethereum in a sensitive phase where price strength is visible, but broader confirmation remains dependent on how capital positioning evolves.
Market Context: Price Strength Emerges Amid Structural Tension
Ethereum’s recent advance comes after a period of consolidation, with buyers stepping in aggressively on lower timeframes. Both 1-hour and 4-hour charts now reflect improving structure, supported by bullish EMA and MACD signals.
At the same time, Ethereum ETFs have recorded continuous net outflows for four consecutive days, highlighting ongoing institutional caution despite rising spot prices. This divergence between spot momentum and ETF flows adds complexity to the current setup.
Ethereum ETF Flows: Persistent Outflows Signal Caution
According to public data from CoinMarketCap, Ethereum ETFs have experienced four straight days of net outflows, reinforcing the idea that institutional inflows have yet to confirm the recent price rebound.
- Latest daily net flow: –$224.2M
- Short-term trend: Consistent negative flows
- Implication: Risk reduction rather than accumulation
ETF outflows do not necessarily indicate immediate downside, but they do suggest that larger capital pools remain selective, especially near key price zones.
For reference, readers can review Ethereum ETF market data on CoinMarketCap.
1H Timeframe Analysis: Momentum Builds With Volume Expansion
On the 1-hour timeframe, Ethereum is showing strong short-term momentum:
- Price: $3,009
- RSI: 66
- EMA: Price above EMA
- MACD: Bullish
- Bollinger Bands: Upper range
- Volume: Spike (recent)
The combination of EMA Bull + MACD Bull, alongside a clear volume spike, suggests active participation from short-term traders. RSI near 66 reflects strength without entering extreme overbought conditions.
This type of setup typically signals momentum continuation attempts, though sustainability depends on follow-through across higher timeframes.
4H Timeframe Analysis: Structure Improves, Trend Attempts to Shift
Ethereum’s 4-hour chart reinforces the improving technical picture:
- RSI: 48
- EMA: Bullish crossover (recent)
- MACD: Bullish
- Bollinger Bands: Mid-range
- Volume: Spike
- Net Whale Exposure (4H): ~$421M Short Heavy
The recent EMA crossover on the 4H chart suggests a potential trend stabilization phase, rather than a simple intraday bounce. RSI near neutral indicates that momentum is rebuilding from a balanced state.
However, despite bullish indicators, whale exposure remains heavily skewed to the short side.
Whale Positioning: Heavy Short Bias Persists
Whale Overview
- Bias: Bearish
- Total Whale Volume: $876.1M
- Long Volume: $227.8M
- Short Volume: $648.3M
- Net Whale Position: Short Heavy
Position Distribution
- Long %: 9.4%
- Short %: 90.6%
- Average Entry: $3,171.94
- Average PnL: 46.06%
Despite Ethereum’s price recovery, whales remain overwhelmingly positioned on the short side. This suggests that larger participants are either hedging existing exposure or expressing skepticism about the sustainability of the current move.
The gap between spot price ($3,009) and average whale entry ($3,171) also indicates that some positions remain under pressure, increasing sensitivity to volatility.
Indicator vs Whale Conflict: A Key Theme
Ethereum’s current setup is defined by conflicting signals:
- Indicators: Bullish across 1H and 4H
- Volume: Expanding
- ETF Flows: Negative
- Whales: Heavily short
This type of divergence often reflects a market driven by momentum and short-term participation, while institutional and whale capital remains defensive.
Such conditions do not invalidate price strength — they highlight that confirmation is incomplete.
Retail vs Whale Psychology
- Retail traders often respond to EMA crossovers, RSI recovery, and visible price acceleration.
- Whales and institutions focus on positioning efficiency, risk exposure, and broader flow data.
With Ethereum ETFs seeing continued outflows and whales maintaining short exposure, the current rally appears momentum-led rather than flow-confirmed.
Volume as the Deciding Variable
One of the most important elements in the current Ethereum setup is volume behavior:
- Short-term volume spikes support recent price gains
- Sustained multi-timeframe volume expansion would be needed to shift broader conviction
Without that, markets often transition into consolidation or volatility rather than clean continuation.
Scenario Framework (No Prediction)
Rather than forecasting outcomes, current data supports two neutral paths:
Scenario 1: Momentum Stabilization
If Ethereum holds above key EMAs and volume remains supportive, price may consolidate at higher levels while indicators cool.
Scenario 2: Positioning Friction
If ETF outflows and whale shorts persist, price may experience heightened volatility as positioning adjusts around key levels.
Both scenarios reflect decision-driven conditions, not directional certainty.
What the Data Currently Suggests
Ethereum’s current market state reflects:
- Visible short-term strength
- Bullish indicator alignment
- Heavy whale short exposure
- Persistent ETF outflows
Together, these signals point to a market that is active but unresolved, where price momentum and capital positioning have yet to fully align.
🔗 Related Internal Analysis:
For more Ethereum research and updates, visit:
Ethereum ETF market data on CoinMarketCap
Disclaimer
This article is for informational and educational purposes only and does not constitute financial advice. Cryptocurrency markets are volatile, and readers should conduct their own independent research.