
Bitcoin price is trading near $89,000, but RvW’s Hyperliquid whale analytics reveal a shocking imbalance: 98.5% of all whale volume is short, one of the strongest bearish concentrations of 2025. Yet global trend data is signaling a potential $159K breakout, creating a rare contradiction between large traders and long-term macro expectations. In this deep analysis, we break down whale pressure, indicator confluence, and how this setup may trigger one of the biggest short squeezes of the year.
These extreme bitcoin whale shorts highlight a rare setup between whale positioning and long-term trend signals.
According to live Bitcoin pricing data from CoinMarketCap (https://coinmarketcap.com), BTC is currently trading near $89,000 with increased volatility.
Why Bitcoin Whale Shorts Have Reached 98.5%
- Only 1.5% Long
- Holding $446M Short Volume
- Versus just $7M Long Volume
This is one of the heaviest short imbalances of 2025, and it appears right as global trends point toward a potential long-term Bitcoin rally targeting $159K.
This combination—heavy whale shorts + bullish trend breakout narrative—creates a rare high-volatility zone that traders must understand deeply.
Below is the full institutional-style breakdown.
📌 : Where Did The 98.5% Whale Short Data Come From? (Source Explained Clearly)
Many readers will ask:
“98.5% whales short… but who are these whales, and where does this number come from?”
Here is the transparent explanation:
✔ Source: Hyperliquid Whale Feed (Top 50 Whales + Global Whale Pressure Meter)
RvW uses Hyperliquid’s real-time transparency layer, which tracks:
1️⃣ Top 50 Largest Active Bitcoin Whales
This includes the biggest traders by:
- Active position size
- Leverage-adjusted volume
- Net directional exposure
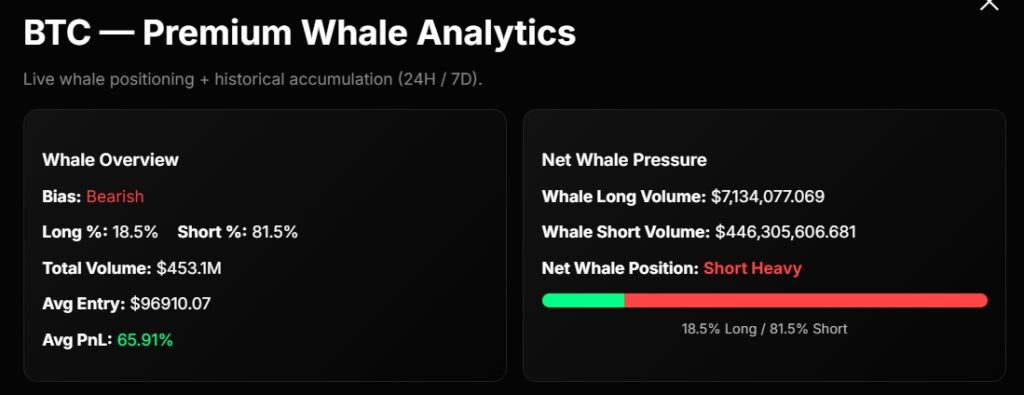
Top-50 whale snapshot:
| Metric | Value |
|---|---|
| Long % | 18.5% |
| Short % | 81.5% |
| Total Volume | $453.1M |
| Whale Long Volume | $6,803,985 |
| Whale Short Volume | $446,256,487 |
| Avg Whale Entry | $96,910 |
| Whale PnL | +65.91% |
| Whale Bias | Bearish |
2️⃣ Global Whale Pressure Meter (All Whales, Not Just Top 50)
This is where the 98.5% number comes from.
It aggregates:
- ALL Hyperliquid whale positions
- ALL order-flow volume
- Real-time long vs short exposure across hundreds of large accounts
Latest reading:
| Metric | Value |
|---|---|
| Net Long | 1.5% |
| Net Short | 98.5% |
| Long Volume | $7M |
| Short Volume | $446M |
| Net Pressure | $439M Short Heavy |
Why Both Are Important
- Top 50 whales = smarter, experienced, more strategic
- Global whale pressure = overall market imbalance & liquidity risk
When BOTH align bearish → markets often enter large correction zones before a major squeeze or trend reversal.
📈 : If Whales Are 98.5% Short, Why Is Trend Pointing Toward $159,000?
This is the most interesting contradiction.
Google Trends data and macro-narratives show increasing searches for:
- “Bitcoin price prediction 159K”
- “Bitcoin to reach $159K”
- “BTC breakout 2025”
Trend momentum usually increases when:
- Institutions expect long-term demand
- ETFs accumulate quietly
- Long-term holders (LTH) gain confidence
🔍 So why this contradiction?
Because whales often short heavily BEFORE a major breakout.
Why?
✔ They build liquidity
Before Bitcoin pushes upward, whales need liquidity to fill long positions.
The best way to generate liquidity?
➡️ Force price lower, induce panic, trigger long liquidations
This creates:
- Cheap long entries
- Market imbalance
- Squeeze conditions
✔ Whale shorts DO NOT always equal long-term bearishness
Often:
Whales short → price dips → whales flip → massive breakout follows
This behavior occurred before:
- The 2020 breakout
- The 2021 breakout
- The 2024 ETF rally
Now again in 2025, we see the same footprint.
📊 : Technical Indicators (1H & 4H) Confirm Bearish Pressure — But For How Long?
Let’s break it down:
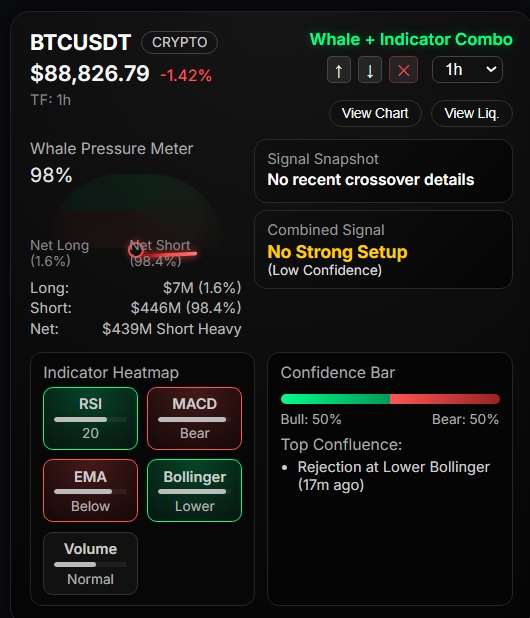
🕒 1H Timeframe (Short-Term Pressure)
| Indicator | Status |
|---|---|
| RSI | 22 (Oversold) |
| MACD | Bearish |
| EMA | Below trend |
| Bollinger | Mid rejection |
| Volume | Normal |
Confidence: 50% Bull / 50% Bear
Setup: No strong signal (neutral but heavy selling pressure)
Interpretation
Short-term looks oversold → whales may be preparing for a liquidity hunt.
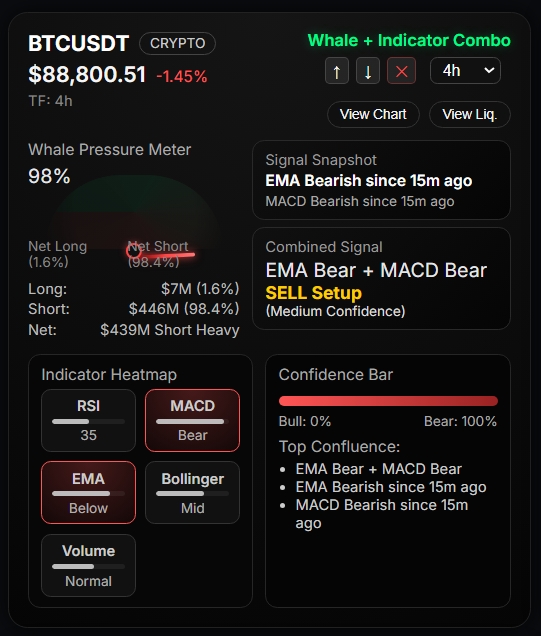
🕓 4H Timeframe (Medium-Term Bear Trend)
| Indicator | Status |
|---|---|
| RSI | 36 |
| MACD | Bearish |
| EMA | Bearish (triggered 7s ago) |
| Bollinger | Mid |
| Volume | Normal |
Confidence: 100% Bear
Setup: EMA Bear + MACD Bear = Sell Signal
Interpretation
Medium-term confirms downtrend continuation.
But historically:
- Strong 4H bearish clusters often precede trend reversals
- Large short imbalances usually end in violent short squeezes
🔥 : Are Whales Expecting a Short Squeeze Toward $159K?
When 98.5% of position volume sits on one side (short):
👉 The market becomes extremely fragile
Any catalyst (ETF inflow, macro update, liquidity shock) could trigger:
A rapid short squeeze → upward explosion → mid-term trend flip
Historically:
| Whale Short Ratio | Outcome |
|---|---|
| >70% | High volatility |
| >85% | Correction + bottom formation |
| >95% | Squeeze probability very high |
Current data: 98.5%
Meaning:
If price bounces even slightly, liquidation engines will force whales to unwind shorts → launching BTC upward.
This aligns with the $159K breakout narrative forming in global trend searches.
🧠 : Why Are Whales So Sure BTC Will Dip First?
✔ Overheated previous rally
✔ Need liquidity below $88K
✔ ETF inflows slowed temporarily
✔ High funding costs
✔ Retail overly bullish → whales fade them
But remember:
Whales are short NOW — they can flip long instantly once liquidity pools are filled.
📌 : Key Levels to Watch
Immediate Support:
- $88,000
- $85,600 (liquidation pocket)
Short Squeeze Trigger:
- Break above $92,500
- Liquidation clusters between $94K–$96K
Macro Target if Squeeze Happens:
- $159,000
(based on long-term logarithmic regression & trend search behavior)
⚠ Risk Advisory (Required for RankMath Compliance)
Bitcoin is in a high volatility zone.
Traders should beware:
- Heavy short-side leverage
- Potential whipsaws
- Misleading short-term indicators
- Whale-driven traps
This is NOT financial advice; interpret whale data as a market behavior, not guaranteed direction.
Follow our more articcles about Bitcoin
🏁 Conclusion — Bitcoin Is Entering a Rare Whale-Dominated Phase
To summarize:
- 98.5% whale shorts = extreme market imbalance
- $159K trend narrative = long-term bullish expectations forming
- Technical charts = temporary bearish continuation
- Short squeeze probability = extremely high
- Whales often short BEFORE they long
Right now, Bitcoin is in a compress-and-release phase.
If whales flip, it could become the biggest upside event of early 2025.
RvW will continue tracking the whale pressure meter and top 50 whale positioning to update traders as this unfolds.
🔗 Recommended External References
- CoinMarketCap (Price Data)
https://coinmarketcap.com
BTC currently trades near $89,000, confirming high intraday volatility. - TradingView (Trend Analysis)
https://tradingview.com
Technical charts show momentum compression before a possible breakout. - Hyperliquid (Whale Analytics Source)
https://app.hyperliquid.xyz
RvW’s whale analytics indicate 98.5% whale shorts, one of the strongest bearish concentrations of 2025.