
By RvW Research Team — December 8, 2025
Bitcoin price analysis today shows BTC attempting a recovery after bouncing from the $87,000 liquidity pocket, briefly testing the $92,000 resistance before losing momentum. While the 4-hour chart signals early stabilization, the 1-hour timeframe has turned sharply bearish due to extreme whale short dominance, with more than $400M in short positions pressuring the market. This Bitcoin analysis highlights key levels to watch, including major resistance at $92K and downside risk around $89.8K, as short-term indicators point toward potential pullback conditions.
This combination creates a split market:
✔️ 4H showing early bullish momentum
❌ 1H showing strong bearish reversal signals
Let’s break down the data.
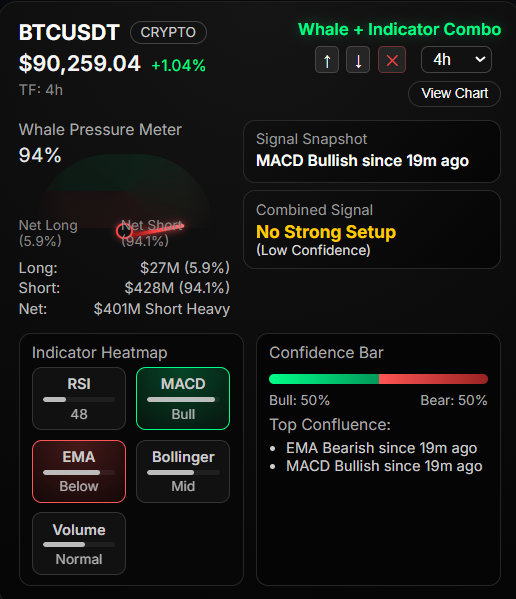
🐋 Whale Pressure Meter (4H): 94% — Still Short-Heavy
Despite BTC testing higher levels, whale behavior continues to dominate the short side:
- Net Long: 6.2%
- Net Short: 93.8%
- Long Value: $28M
- Short Value: $428M
- Net Difference: $400M short-heavy
What this means:
Whales are aggressively hedged against upside moves.
Even though price rebounded from $87K, this was not driven by strong buying, but rather a liquidity-driven bounce.
This explains why BTC failed to break $92K — whale shorts are suppressing upside momentum.
📈 4H Indicator Snapshot — Mixed Signals
MACD — Bullish (since 11 minutes ago)
Momentum is slowly turning positive after days of weakness.
But bullish strength is still weak.
RSI — 47 (Neutral)
Room for both upward and downward movement.
EMA — Price Below EMA Ribbon
Trend remains bearish until BTC closes above the 4H EMAs.
Bollinger Bands — Mid Zone
Price is compressing → volatility expansion likely soon.
Volume — Normal
No large accumulation from institutions yet.
4H Combined Signal: Neutral
MACD Bullish + EMA Bearish = No clean trend
This often happens during the early stage of a trend reversal — confirmation is still missing.
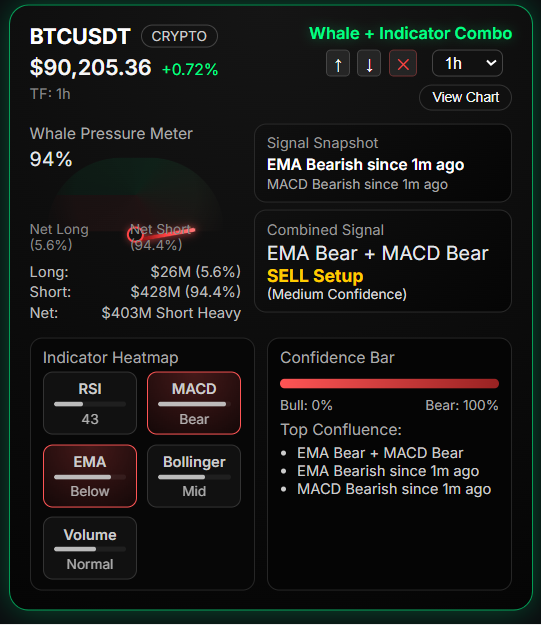
🔥 NEW 1H Technical Analysis — Market Turns Bearish Again
The 1-hour chart flips the entire narrative.
🐋 Whale Pressure Meter (1H): 94% Short Dominance
- Net Long: 5.7%
- Net Short: 94.3%
- Long Value: $26M
- Short Value: $428M
- Net Difference: $403M Short Heavy
Interpretation:
Whales are aggressively shorting the 1H timeframe.
Whenever whale pressure exceeds 90%, intraday pullbacks are extremely common.
🔻 1H Indicator Snapshot — Fully Bearish
EMA — Bearish (since 25 seconds ago)
Price has slipped back under the EMA ribbon → immediate weakness.
MACD — Bearish (since 25 seconds ago)
Momentum turned negative sharply after a failed breakout attempt.
RSI — 42
Not oversold yet → more room to fall.
Bollinger Bands — Mid Zone
Compression forming → volatility spike likely.
Volume — Normal
No signs of dip buying.
🔥 Combined 1H Signal: EMA Bear + MACD Bear → SELL Setup
Confidence: Medium
This confluence appears before 1–3% intraday dips, especially during whale-dominant short conditions.
Confidence Bar (1H)
- Bull: 0%
- Bear: 100%
There is zero bullish strength in the 1H chart right now.
📊 Multi-Timeframe Summary: 4H vs 1H
| Timeframe | Trend | Momentum | Whale Pressure | Signal |
|---|---|---|---|---|
| 4H | Bearish | Bullish MACD | Short-heavy | Mixed / Neutral |
| 1H | Bearish | Bearish MACD | Very short-heavy | SELL |
Interpretation:
The 1H chart overrides the 4H weak bullish momentum.
Unless BTC quickly breaks and holds above $92K, the short-term outlook is bearish.
🧭 Updated Key Levels With 1H Influence
🔼 Upside Resistance
- $92,000 — Must reclaim to flip short-term bullish
- $94,500 — Whale liquidity pocket
- $97,200 — Pre-breakout resistance
- $100,000 — Psychological barrier
A breakout above $92K would invalidate the 1H bearish bias.
🔽 Downside Support
- $89,800 – $90,200 → At high risk of breaking
- $87,500 – $88,300 → Whale re-accumulation zone
- $85,900 → Major structural support
Given the 1H reversal and whale shorts, BTC is more likely to revisit $89.8K, and if weakness persists, dip toward $88K.
🎯 Final Outlook — Neutral to Bearish
- 4H shows early recovery signs ⚡
- 1H turned strongly bearish again 🔻
- Whales hold over $400M in shorts across both timeframes
- Momentum is weakening below $92K resistance
Conclusion:
BTC needs a strong breakout above $92,000 to regain bullish structure.
Until then, intraday pullbacks toward $89.8K–$88K remain the most likely scenario.